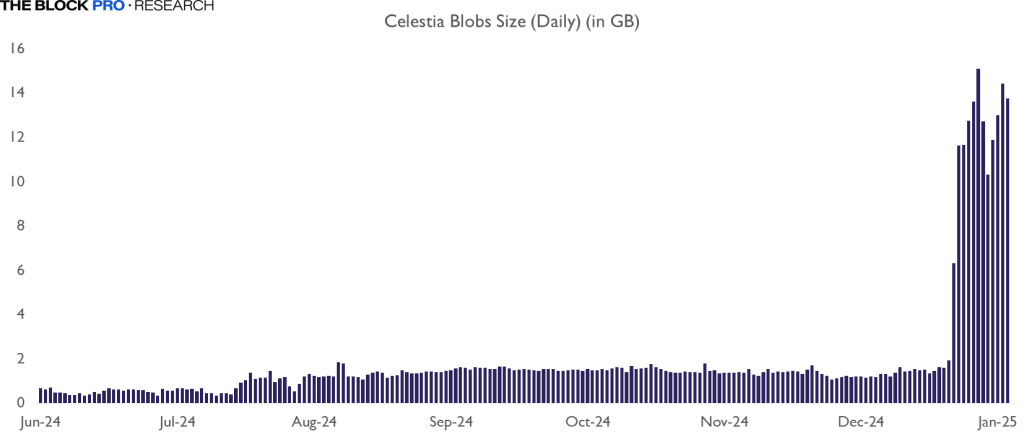
On January 9th, Wednesday, the Celestia price dived 8.2% to currently trade at $4.4. The selling pressure likely followed broader market correction as Bitcoin extended correction below $100k. However, the TIA coin hovering close to multi-month support indicates limiter downside potential and a quick rebound opportunity with the surge in network activity.
According to CoinGecko, the TIA’s market cap stands at $2.18 Billion, with a 24-hour trading volume of $218 Million,
Key Highlights:
- Celestia’s blob size surged from under 1 GB to 11.4 GB in just two weeks, reflecting significant network activity.
- Multiple reversals from the $3.7-$4.1 support zone indicate a high-accumulation point for buyers.
- The formation of a rounding bottom pattern could bolster recovery sentiment in Celestia price.
Celestia Price Gains Momentum as Network Activity Skyrockets
According to data from The Block Pro’s dashboard, Celestia has experienced a significant spike in its network activity over the past two weeks. The size of Celestia’s blobs—a critical metric for data storage—has surged tenfold, reaching an impressive 11.4 GB.
This growth is attributed to increased NFT minting activity, including projects like Mammoth Overlord, the integration of the RARI chain, and heightened activity from Eclipse.
Moreover, the TIA’s Daily transactions jumped 60% to 71,000, showcasing growing usage and adoption of the Celestia ecosystem.
The substantial surge in network activity should positively impact native token TIA for a potential rebound.
TIA Eyes Recovery as Rounding Bottom Pattern Forms
Amid the Bitcoin price dive below $100k, the Celestia price witnessed a surge in selling pressure. A bearish momentum plunged the asset from $5.6 to $4.4 — a 21% drop — in the last three days.
With sustained selling, the altcoin could plummet another 18% to retest the base support of a six-month accumulation trend. The long-sideway movement, along with the RSI (35%) indicator heading to the oversold region, indicates potential bottom formation before a renewed recovery trend.

The daily chart analysis shows a potential formation of a classic reversal pattern called the rounding bottom. Under the pattern’s influence, the Celestia price could recover steadily and chase the potential target of $7.2, followed by $12 before a key breakout.
Also Read: Exodus Crypto Wallet Rings NYSE American Opening Bell


