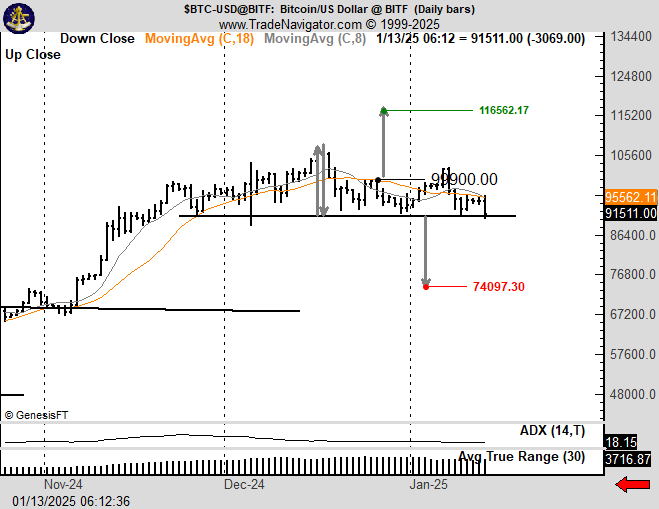
On January 14th, Monday, the Bitcoin witnessed heightened volatility as the price teased breakdown below $90,000 before bouncing back. In the past 24 hours, the crypto market recorded a total liquidation of $820.17 million among 271,048 traders. The market FUD teases a potential for prolonged downfall with key reversal patterns and whale activity.
By press time, BTC’s market cap wavers at $1.874 Trillion, while the 24-hour trading volume is at $73 Billion.
Key Highlights:
- The formation of head and shoulder patterns could influence the Bitcoin price for a $90,000 breakdown.
- The $91,200 support stands as a key support zone for buyers to prevent major corrections.
- Over the past 12 months, the amount of Bitcoin held by long-term holders has been steadily decreasing.
Bitcoin Price Battles Critical Neckline Support
Veteran trader Peter Brandt shared an intriguing analysis of Bitcoin’s (BTC) current market behavior, describing it as a “knife fight at the OK Corral.” His tweet references the intense tug-of-war between bullish (Team Green) and bearish (Team Red) forces as the asset’s price hovers near critical levels.
Brandt’ attached chart highlights the Bitcoin price consolidation above $91,200. The sideways action shows the formation of a classic reversal pattern called head and shoulders. Theoretically, the setup displays three peaks, with the middle extending higher than the other two usually the same height.
If the pattern holds true, the Bitcoin price correction has just started, and a breakdown below the key neckline support at $91,200 will accelerate the selling. The post-breakdown fall could plunge the asset 19% down to hit $73,900.

Falling BTC Long-Term Holdings Suggest Price Downturn Ahead
According to a recent tweet from IntoTheBlock, the amount of Bitcoin held by long-term holders has been steadily declining over the past 12 months. This trend aligns with patterns observed in previous market cycles, marked by red arrows on the accompanying chart.
Past cycles indicate that periods of declining long-term holdings often precede a shift from selling pressure to renewed accumulation, typically coinciding with a price downturn.
On the contrary note, if Bitcoin price holds $91,200 support, the consolidation trend could prolong and renew the bullish momentum.
Also Read: Indian Crypto Exchange Mudrex Freezes Crypto Withdrawals


