
")
On February 18th, Tuesday, the Chainlink price plunged over 6% to currently trade at $17.8. The selling pressure can be attributed to prolonged market consolidation and LINK’s coin losing daily EMAs. However, the formation of a traditional continuation pattern sets the asset for potential rebound and chase ley towards a $30 high.
Key Highlights:
- A flag pattern formation drives the current correction trend in Chainlink price.
- The $15.4 level, blacked by the bottom trendline of the flag pattern, creates a high accumulation zone for buyers.
- A recent bearish crossover between the 50-and-100-day exponential moving average bolstered sellers for prolonged downfall.
Crypto Whales Bet Big on LINK as MVRV Ratio Hits Key Level
In the last three weeks, the Chainlink price experienced a notable correction from $26.4 high to $17.7, registering a loss of 34.5%. This decline also plunged LINK’s Market value to Realized (MVRV) ratio to a historical bullish threshold.
According to market analyst Ali Martinez, LINK has shown a pattern of strong rebounds whenever its MVRV drops below -16%, with previous surges of 312%, 64%, 61%, 25%, and 52% following similar dips.
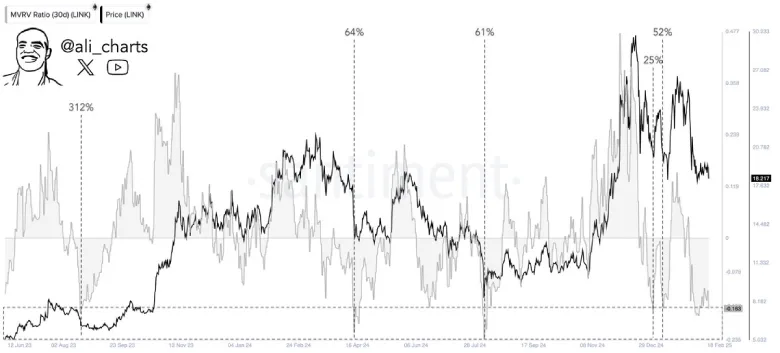
Currently, the MVRV sits at -16.3%, suggesting that the asset is in a potential accumulation zone and could experience another price surge in the near future.
Adding to the bullish outlook, the crypto whales have bought over 1.10 million LINK in the last 24 hours of reporting. Historically, an accumulation trend from large investors has preceded the market bottom or sharp price increase.
Chainlink Price Hints Major Reversal Within Flag Pattern
With an intraday loss of 6.8%, the Chainlink price offers a suitable follow-up to the recently breached $19.3 support and extends correction below the 200-day EMA slope. This breakdown accelerates the bearish momentum, which sellers could utilize to push the asset 14% down to $15.4.
The aforementioned support backed by the support trendline of a flag pattern indicates a high accumulation point for investors. Since mid-December, the LINK price has resonated within two downsloping trendlines, offering dynamic resistance and support.
Theoretically, the chart setup drives a temporary pullback for buyers to recuperate the exhausted bullish momentum.
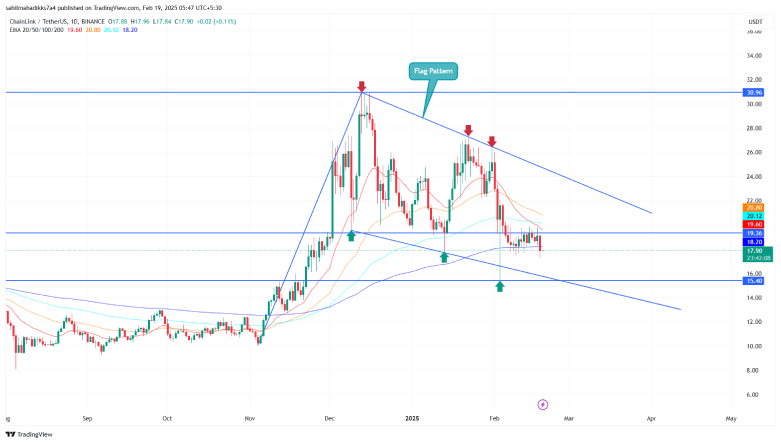
If the pattern holds true, the LINK price could rebound from the support trendline and chase the $22.4 mark to challenge the overhead trendline. A potential breakout will signal the end-of-current correction trend.
Also Read: Solana Price Faces 40% Downside Risk As Key Reversal Pattern Emerges


