

LINK, the native cryptocurrency of the decentralized Oracle network Chainlink, records a 16% decrease in the last 48 hours to trade at $14.74 currently. The selling pressure can be attributed to a broader market correction following Trump’s decision to implement tariffs on Canada and Mexico. Amid the notable correction, the Chainlink price witnessed a breakdown below key support and a notable inflow into exchanges, signaling the risk of further downfall.
Key Highlights:
- 610,000 LINK tokens transferred to exchanges in the last 24 hours, signaling potential sell pressure.
- Chainlink price breakdown from flag pattern signals intense selling pressure in the market.
- The $15.4 region backed by 111.97 Million LINK supply creates a strong resistance zone against buyers.
Chainlink Price Faces Major Resistance Amid Rising Exchange Inflows
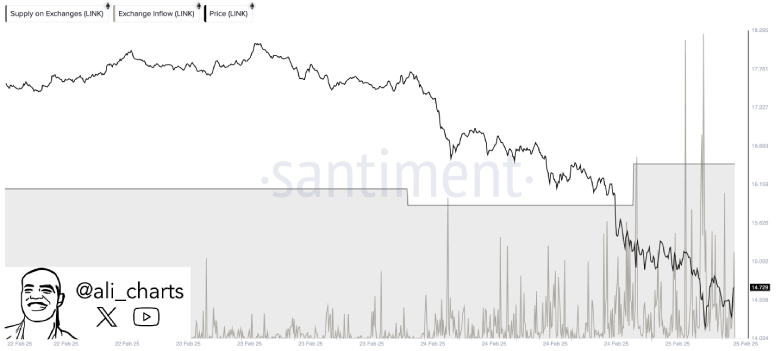
Over the past month, the Chainlink price experienced a notable retracement from a $27.2 high to the $14.76 current trading price, losing 45% in value. Amid this correction, the on-chain data reveals that 610,000 LINK tokens have been transferred to cryptocurrency exchanges in the past 24 hours.
The accompanying chart by analyst Ali Martenz illustrates a clear increase in LINK’s exchange supply, coinciding with a declining price trend, reinforcing concerns of heightened sell-offs.
In addition, Chainlink’s In/Out of the Money chart shows a high supply of 111.97 Million LINK tokens at an average price of $15.16. The chart from intotheblock highlights this level as an immediate resistance, represented by a large red circle, indicating that a substantial number of investors purchased LINK near this price.
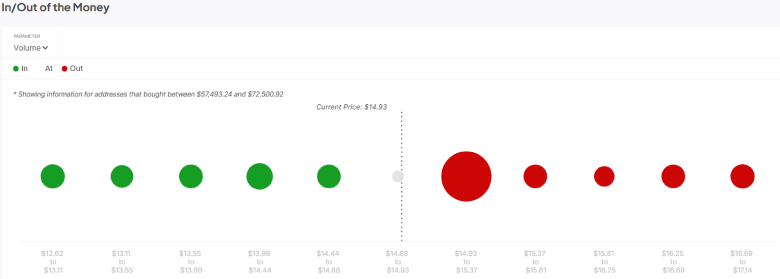
When the asset approaches this zone, holders who were previously at a loss may look to break even and sell, increasing selling pressure and making it harder for LINK to break above this level.
LINK Lose Key Support of Bullish Pattern
Chainlink’s daily chart analysis shows a sustained correction trend with low higher and lower low formation. This downfall resonates within two downsloping trendlines, revealing the formation of a flag pattern.
Typically, the chart setup offers a short pullback for buyers to regain bullish momentum and resume the prevailing uptrend. However, with the current market correction, the LINK price breaks below the pattern’s lower trendline, signaling an overwhelming selling pressure.
If the daily candle closes below $15.4(coinciding close with the aforementioned supply zone), the sellers could strengthen their grip over this asset. The post-breakdown fall could plunge the asset by 15% to hit $12.85, followed by $10.
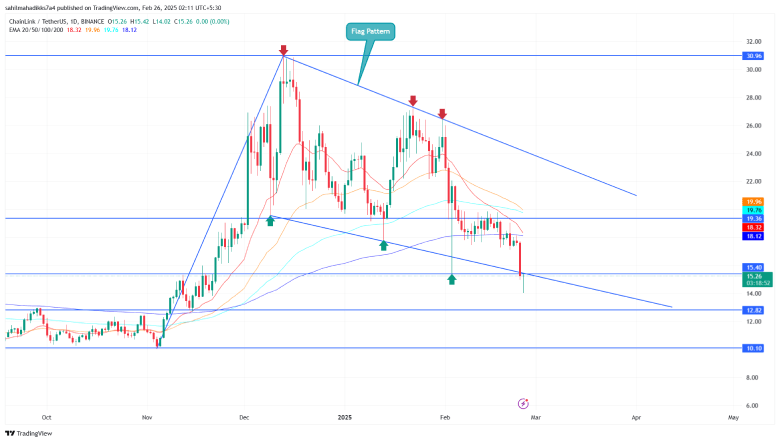
Conversely, if the price bounces back within the flag channel, the bearish thesis will be invalidated.
Also Read: Bitcoin Plummets Below $90K Mark, Extreme Fear Takes Hold of the Market


")


