

During Friday’s U.S. market session, the crypto witnessed a quick surge in buying pressure evidenced by Bitcoin’s long-tail rejection candle. The bullish turnaround bolsters top altcoins like Ethereum to stabilize above the major support level, opening up an opportunity. Does the ETH’s historical performance in March support this upswing?
Key Highlights:
- Ethereum’s historical March performance shows an average gain of +22.8%, suggesting a typically strong month.
- Since June 2022, an ascending trendline of daily charts has acted as a key accumulation zone for crypto buyers.
- A bearish crossover between the 100-and-200-day Exponential Moving Average could delay the recovery potential of the ETH coin.
ETH Historical Trend and March 2025 Outlook
Ethereum’s historical performance in March has generally leaned towards positive returns, with an average gain of +22.8% and a median return of +10.58%. This suggests that March has often been a strong month for ETH, although it has also experienced volatility in certain years.
Notable bullish performances include 2017 (+214.11%), 2021 (+34.74%), and 2023 (+13.46%). Conversely, the ETH price shows negative returns in 2018 (53.79%) and 2020 (38.98%). This downtrend could be linked to ba roader market correction or macroeconomic concerns.
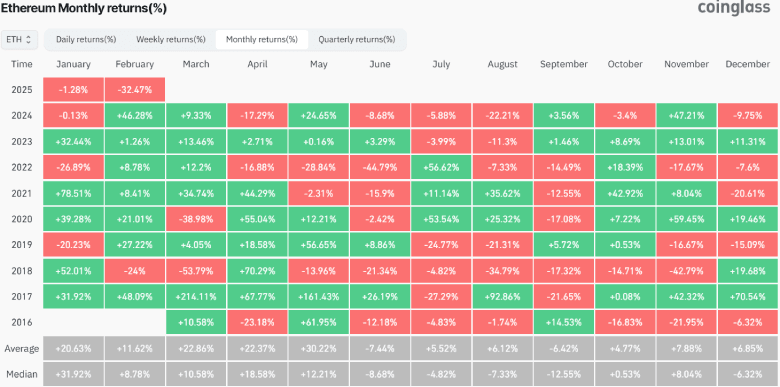
Given the strong historical average and median return, March 2025 could present an opportunity for the Ethereum price to establish a stable bottom and recuperate recovery momentum.
Ethereum Price Analysis Hints Bottom Support
In a five day downfall, the Ethereum price plunged from $2,838 to $2,234 currently trading value, registering a loss of 27%. This downfall, backed by increasing trading volume and a downward curve in daily EMA ( 20, 50, 100, and 200), indicates sellers’ dominance.
However, the ETH price is witnessing renewed buying pressure at the $2,080 level, currently coinciding with a long-coming support trendline. Since June 2022, the ascending trendline has acted as a key accumulation zone for buyers to replenish the exhausted momentum and initiate a fresh recovery cycle.
The long-tail rejection in today’s candle indicates the intact demand pressure and potential for price rejection. While the current market correction could drive a sideways action above $2,100, a bullish breakout from the overhead resistance trendline will provide confirmation for the uptrend.
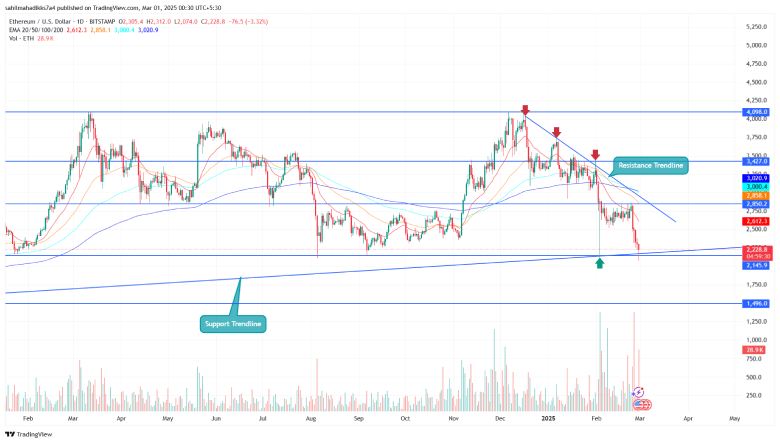
Conversely, a breakdown below the support trendline will invalidate the bullish thesis and drive a major correction.
Also Read: CZ Reassures Investors: Dips Are Just Part of the Free Market Cycle


")


