

On February 28th, Friday, the crypto market witnessed a renewed bullish momentum as Bitcoin rebounded from the $80k level with a long-tail rejection candle. A similar momentum spread in the altcoin market as top assets like XRP show suitability above key support. However, a notable decline in whale buying activity has raised concerns about a notable breakdown in Ripple cryptocurrency.
Key Highlights:
- XRP whale holdings have dropped significantly, often signaling a local top before a potential reversal.
- A long-tail rejection candle with a $2 psychological support indicates an intact demand pressure
- The head and shoulder pattern set the XRP price for an extended downtrend below $2.
XRP Price Peaks as Whale Holdings Decline
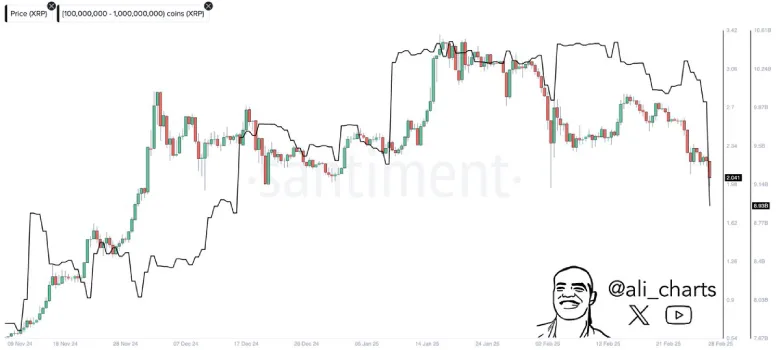
In a recent tweet, renowned crypto analyst Ali Martinez highlighted how XRP price continues to be closely intertwined with whale activity. His latest chart from Santiment indicates an interesting correlation between the buying and selling patterns of XRP whales (holders of 100 million to 1 billion XRP) and the asset’s price fluctuations.
The chart reveals a compelling trend: when whale holdings decline, XRP price often hits a local top before reversing downward. Conversely, periods of strong whale accumulation have historically coincided with price recoveries.

This week, the onchain metric shows a dramatic decline, indicating the lack of buying pressure from large investors and the risk of a potential breakdown.
Also Read: Will Ethereum Follow Its Historical Trend? March Price Prediction
Head and Shoulders Pattern Signals a Deeper Correction
By the press time, the XRP price trades at $2.14 with an intraday loss of 2.2%. Despite the intraday sell-off, the daily candle shows a long-tail rejection at $2 support, indicating a demand pressure.
However, this support stands as the neckline of a well-known reversal pattern called head and shoulder. This chart setup is commonly spotted at major market tops as its three peaks signal intense overhead supply.
The momentum indicator, RSI, down to 32%, indicates strong seller dominance potential for prolonged correction.
If the pattern holds, the market selling pressure could force a breakdown below the $2 floor with a daily candle closing. If successful, the post-breakdown fall could plunge the asset to $1.28, followed by an extended dip to $0.62.


")


