

During Friday’s U.S. trading selling, the crypto market witnessed a surge in buying pressure, evidenced by Bitcoin’s long-tail rejection at candle $80k. The renewed demand pressure at a key Fibonacci retracement level hints at an opportunity for a bullish reversal and replenishes the prevailing uptrend.
According to CoinGecko, the asset’s market cap is at $1.667 Billion, while the 24-hour trading volume is at $83.3 Billion.
Key Highlights:
- Historical March performance shows an average return of +13.42%, signaling a tendency for recovery.
- A double-top pattern, signaling a distribution phase in BTC, signals a drop to $75,000.
- A bearish crossover between 50-and-100-day exponential moving averages could delay recovery momentum in Bitcoin price.
Bitcoin Historical Performance in March Volatility.
Bitcoin’s historical performance in March has shown a mix of strong gains and significant declines, making it a month of volatility. According to historical data from the image, Bitcoin’s average return for March stands at +13.42%, with a median return of +0.50%, indicating a tendency for positive movement, albeit with notable fluctuations.
Some of the most bullish March performances include 2013 (+172.76%), 2021 (+29.84%), and 2023 (+22.96%). These notable gains indicate the Bitcoin price shows a recovery tendency in March.
Conversely, the BTC price witnessed a significant correction in 2018 (-32.85%), 2020 (-24.92%), and 2017 (-9.05%), showing that this month is not always bullish.
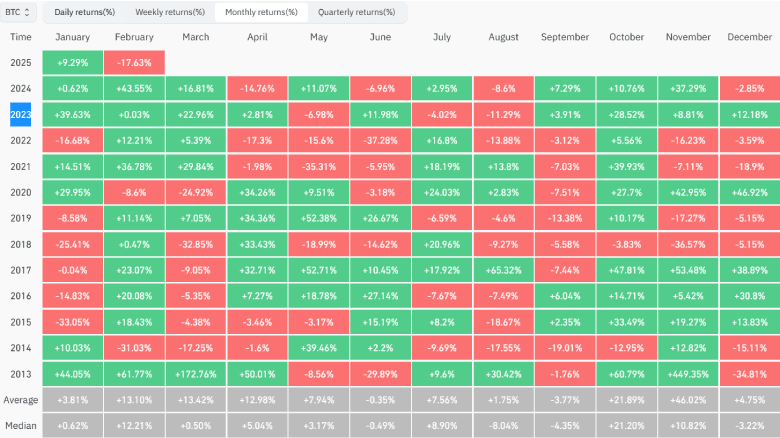
Given the strong historical average, March 2025 could present an opportunity for Bitcoin to form a stable bottom support and drive a bullish recovery.
Double-Top Pattern Signals Bitcoin Price Correction
By the press time, the Bitcoin price traded at $84,053 with an intraday loss of 0.71%. Despite the slight downtick, the daily candle shows a long-tail rejection at $80,000, indicating a surge in demand pressure.
The aforementioned support, coinciding with the 50% retracement level, accentuates that the current correction lies within the health remark of the Fibonacci tool. Historically, these FIB levels bolster buyers to replenish the exhausted bullish momentum for a fresh recovery trend.
Thus, the BTC price shows a high potential for an 8% upswing and challenges the $91,500.
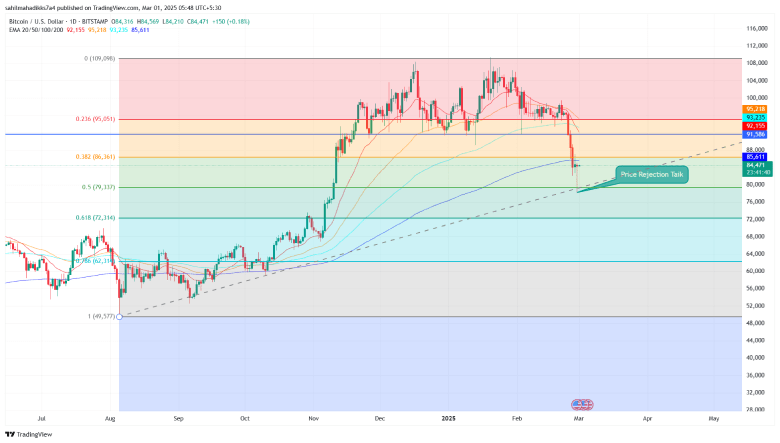
The potential breakout will get the necessary confirmation for buyers to drive the continuing prevailing uptrend.
Also Read: Will Ethereum Follow Its Historical Trend? March Price Prediction


")


