On January 9th, Thursday, Bitcoin plunged over 2% to trade at $93,060. The downswing is nearing a bearish breakdown from monthly support of $91,500, signaling a potential for prolonged downfall. However, crypto analysts believe such corrections or ‘boring phases’ are part of the BTC cycle nature before their recuperate bullish momentum for a stronger recovery.
By press time, BTC’s market cap wavers at $1.84 Trillion, while the 24-hour trading volume is at $56 Billion.
Key Highlights:
- The falling Bitcoin price could witness suitable support at $85,500 and $79,000.
- BTC’s 100-day Moving Average of the MVRV ratio supports a bullish outlook for the ongoing cycle.
- The coin price holding above 50% Fibonacci retracement level indicates the broader market is bullish.
Bitcoin’s Historical Cycles Suggest Explosive Rally Ahead
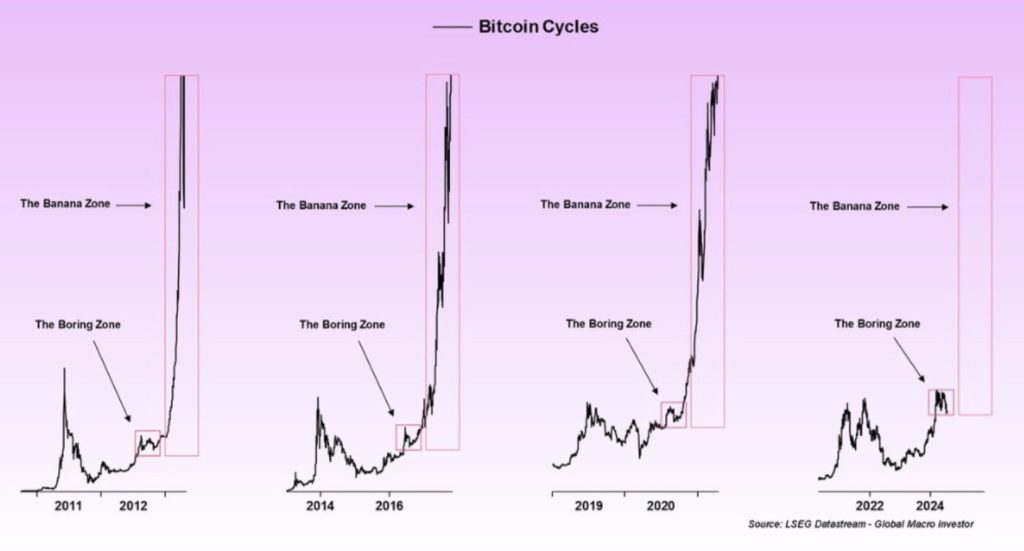
In a recent tweet, Bitcoin enthusiast Pete Rizzo highlights the cyclical nature of the pioneer cryptocurrency amid the current market uncertainty. His post, accompanied by a chart of historical Bitcoin cycles, reminds his X followers that BTC is always “boring” before embarking on a parabolic surge.
The chart illustrates the asset’s performance since 2011, clearly demarcating phases labeled as the “Boring Zone,” which are followed by explosive growth into the “Banana Zone,” signifying massive price rallies. This pattern appears consistent across previous bull and bear cycles, reinforcing the notion that periods of low volatility often precede significant upward moves.

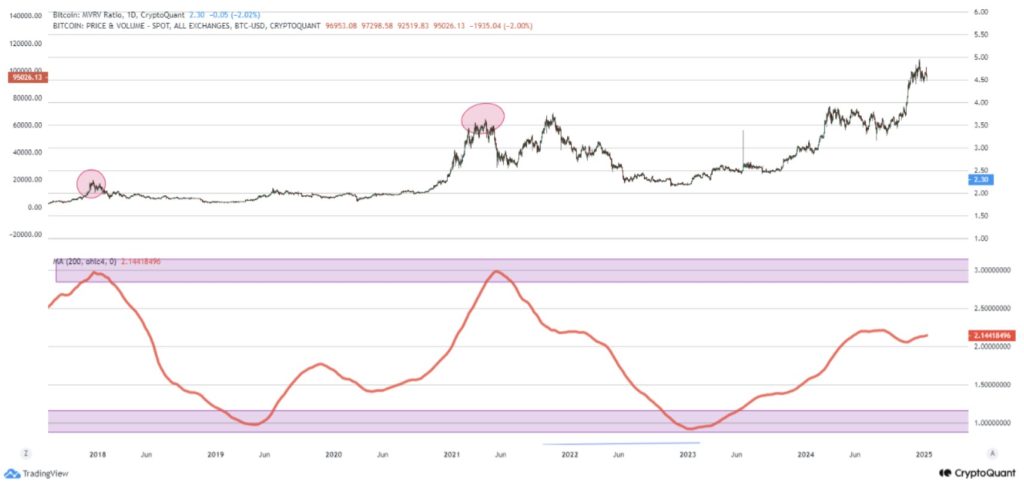
Supporting the bullish thesis, Bitcoin’s 100-day Moving average of the MVRV (Market Value to Realized Value) ratio indicates that the cryptocurrency has not yet reached the peak price of the ongoing cycle.
Historically, the MVRV metric hit a value of 3 during the last two bull runs. Currently, CryptoQuant’s analysis shows the MVRV indicator still wavering 2.14 range, implying the potential for further price growth.

Key Fibonacci Support to Watch in Bitcoin Price Correction
In a three-day fall, Bitcoin price plunged from $102,760 to $91,762, registering a loss of 10.7%. The correction trend is currently teasing a bearish breakdown from monthly support of $91,500, signaling the potential for a prolonged downfall.
According to the Fibonacci retracement level, the BTC price could plunge 7.5% to test the support of 38.2% FIB level at $85,500, followed by a fall to $79,000— 50% FIB.

Generally, the coin price holding above these levels indicates the broader market sentiment is bullish, and buyers could recuperate bullish momentum for the next leap.
Also Read: Standard Chartered Launches Crypto Custody Services in EU


