

On March 5th, the crypto market showed a slight relief from the ongoing traffic war between countries like China and Canada with the United States. As a result, the Bitcoin price surged above $90,000, while the Ethereum price showed resilience above $2,000. While the market is yet to confirm trend reversal, onchain data of ETH coin shows a deep undervalue state, suitable for potential bottom formation.
Key Highlights:
- Since mid-December 2024, a downsloping resistance trendline has led to a steady correction trend in ETH.
- A recent fake breakdown from Ethereum price below multi-year support signals a reversal setup for a $2,500 breakout.
- The MVRV ratio dropping below 1 suggests ETH is heavily discounted, indicating a potential bottom formation.
ETH MVRV Dips to Accumulation Zone
In the last two weeks, the crypto market witnessed a major downturn following U.S. President Donald Trump’s decision to impose additional tariffs on several countries. The announcement plunged Bitcoin to $80,000 and Ethereum price to $2,000.
While the market selling pressure persists, the onchain indicators signal that the ETH coin is heavily discounted. The Market Value to Realized Value (MVRV) ratio, a key metric for assessing whether an asset is overvalued or undervalued, has dropped below 1—suggesting that the average ETH holder is now at a loss.
The metric, which compares the total market capitalization to the realized capitalization (i.e., the average cost basis of all ETH holders), suggests that the current price is lower than the aggregate acquisition price of ETH investors.

The above chart shows whenever ETH MVRV metric dipped below 1 mark, the coin witnessed renewed bullish momentum followed by strong rallies.
Ethereum Price Action Hints at Bear Trap
During Monday’s trading session, the Ethereum price witnessed a notable downswing and plunged below a long-coming support trendline. Since June 2022, the dynamic support has bolstered ETH buyers with a suitable accumulation, keeping the broader uptrend intact.
Thus, the recent breakdown was anticipated to accelerate the selling pressure but the price did not follow. The long-tail rejection candle in daily chart weakness in sellers conviction which pushed the price back to $2,214. The lack of follow-up marks the previous breakdown as a bear trap— known as a favorable reversal setup.
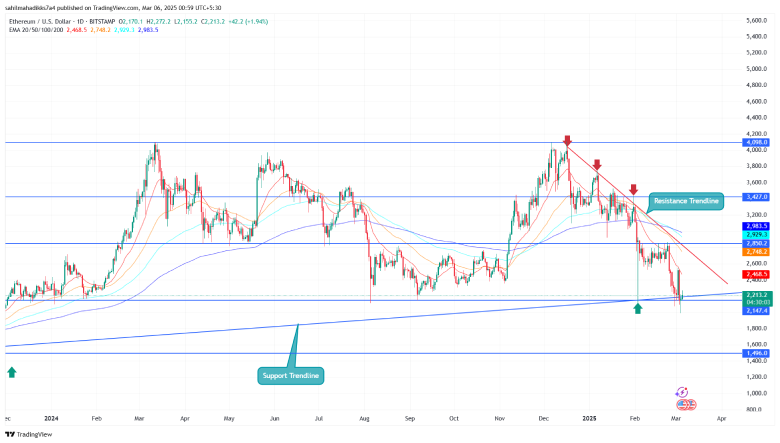
If the Ethereum price holds above $2,145, the buyers could drive a 13% surge to $2,500, nearing a breakout from the key resistance trendline. A surge beyond this downsloping resistance could confirm a renewed recovery trend for these altcoins.
Also Read: CZ Praises Vitalik Buterin’s Contribution to Crypto; Reveals Missed ETH Opportunity


