

HBAR, the native cryptocurrency of the Hedera network, witnessed a significant outflow during Friday’s trading session, registering a 5% intraday loss to reach $0.12. The selling pressure can be attributed to broader market correction as the total liquidation value reached $540 Million while Bitcoin plunged over 3%. However, the Hedera price shows potential for a bullish turnaround as an asset management company submits an amended S-1 for HBAR ETF with the U.S. SEC.
Key Highlights
- The formation of a bullish pennant pattern continues to influence the Hedera price movement.
- The long-wick rejection candle on February 3rd and 18th accentuates high demand pressure at the $0.2-$0.18 range,
- The HBAR price holding above 61.8% Fibonacci retracement level and 200-day exponential moving average indicates the market trend remains bullish.
Canary HBAR ETF Moves Forward with Amended S-1 Filing
On February 21st, Friday, the asset management company Canary filed an amended S-1 registration statement for its HBAR ETF with the U.S. Securities and Exchange Commission (SEC). The amendment, officially labeled as “Pre-Effective Amendment No. 1,” signals that the firm has responded to initial comments from the SEC—an essential step in the approval process.
Eric Balchunas, a senior ETF analyst at Bloomberg, highlights this move mirrors previous ETF filings, such as Litecoin’s, which also underwent amendments before gaining traction. However, a crucial step remains: the submission of a 19b-4 filing, which is necessary for the ETF’s official launch.

The Canary HBAR ETF, once approved, would provide investors with exposure to Hedera’s native token (HBAR), potentially expanding institutional adoption in the digital asset space.
Hedera Price Hints Bottom Formation at $0.18
Over the past months, the Hedera price experienced a sharp correction from $0.4 top to $0.21 current trading value, projecting a 47% loss. However, the falling price backed by low trading volume indicates weakness in sellers’ conviction and a higher potential of a temporary pullback before the uptrend resumes.
However, the correction trend has started witnessing demand pressure at $0.18 price, a support level coinciding close with 61.8 FIB and 200-day EMA slope. The aforementioned levels stand as crucial pullback support in market retracements, signaling the broader trend is bullish.
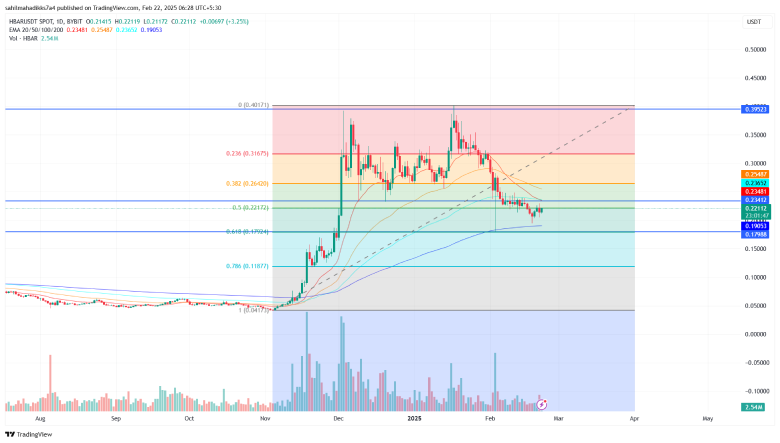
If the buyers manage to hold these levels, the HBAR price could form a potential bottom and renew exhausted bullish momentum. In the coming weeks, the market buyers could anticipate a bullish reversal pattern at $0.18-$0.2, signaling the preparation of the post-correction rally.
Also Read: Ethereum Whales Accumulate 140K ETH as Price Eyes Triangle Breakout


