

Since mid-February, the Solana price has witnessed a surge in selling pressure following controversies related to the memecoin on its blockchain and a looming token unlock event. While the broader market remains uncertain, the SOL coin faces a risk of prolonged downfall as declining network activity and bearish patterns could further increase the selling pressure.
According to Coingecko data, the Solana price trades at $165 with a market cap of $81.2 Billion, while 24-hour trading is at $6.9 Billion.
Key Highlights:
- A notable decline in Solana’s new and active onchain address indicates a slowdown in network activity.
- A double-top pattern bolsters Solana price for a correction below $100.
- A potential bearish crossover between 20- and 100-day EMA accelerated the market uncertainty.
Solana Price Plunges 18.5% Amid Memecoin Controversies and FTX Liquidations
In a 4-day downfall, the Solana price plunged from $200 to $165 level, registering a loss of 18.5%. The surge in selling pressure can be attributed to a series of controversies on SOL-based memecoin like LIBRA, which lost a majority of value last week.
Adding to the bearish sentiment, 11.2 million SOL tokens—valued at approximately $2.06 billion at the time of writing—are set to be unlocked on March 1 as part of the asset liquidations linked to the November 2021 FTX collapse.
Furthermore, the number of active addresses on Solana network plunged from $4.4 million to $4 million, accounting for a loss of 9%. Simultaneously, the number of new addresses fell from $4.43 to $3.52, a 20.59% decrease, according to TheBlock data.

The decrease in active addresses suggests reduced network engagement, potentially signaling lower transaction activity or waning investor confidence.

If the trend continues, the Solana price could face higher selling pressure and extend its current correction play.
Sol Faces 42% Downside Risk as Double Top Pattern Unfolds
With an intraday loss of 9%, the Solana price gave a bearish breakdown from the $173.5 support of the double top pattern. The chart setup is characterized by two major reversals from an almost horizontal level, indicating overhead supply with an ‘M’ shape.
Generally, the pattern is observed at major market tops and drives a sharp correction trend. If the daily candle closes, the sellers could push a 42% fall to hit the $92.5.
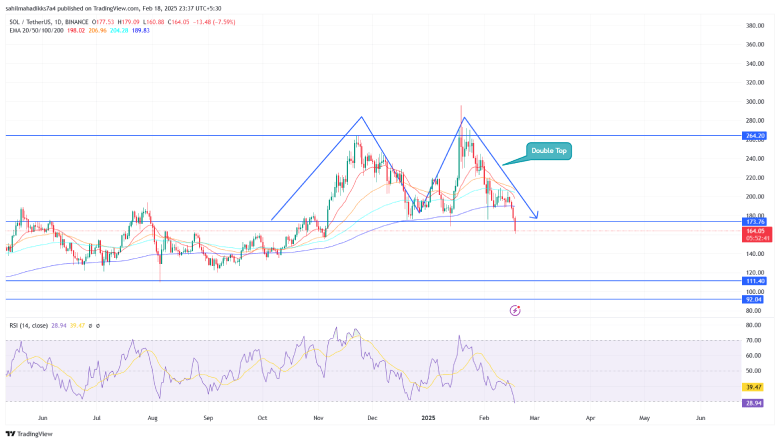
The daily RSI (Relative Strength Index) slope plunge below 30% indicates high selling pressure in the market.
Also Read: Ethereum ETFs See 7x More Inflows in February; Is $4k Rebound Next?


