Since last weekend, the crypto market has witnessed heightened volatility surrounding Donald Trump’s inauguration. Amid the consolidation, the Solana price maintained its bullish outlook as SOL-based PolitiFi tokens boosted network activity and investors’ interest. Will this layer-1 cryptocurrency breach the $500 barrier?
According to Coingecko, SOL’s market cap stands at $121.6 Billion, while 24-hour trading is at $12 Billion.
Key Highlights
- Memecoins gained traction following Donald Trump’s inauguration, driving higher on-chain activity on Solana
- The SOL price is 6.5% short from a bullish breakout from Cup and Handle pattern.
- A bearish divergence in the daily Relative Strength Index increased selling pressure at $265.
Solana TVL Surges on Memecoin Mania: What’s Driving It?
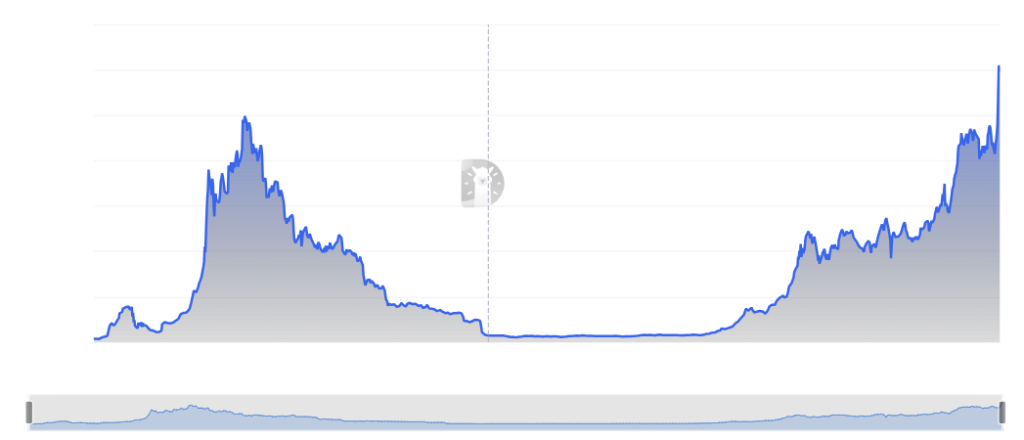
According to DeFiLlama data, the Solana TVL witnessed a significant upsurge from $8.29 billion to $12.1 billion in the last 7 days, registering a 46% growth. This sudden surge can be attributed to the recently launched Solana memecoins like Official Trump (TRUMP) and Melania Meme (MELANIA), which have witnessed increased transactions amid Donald Trump’s inauguration.

The rise in TVL could also signal that more liquidity providers are entering Solana’s ecosystem, further strengthening its position in the DeFi space.
Solana Price: Cup and Handle Pattern Hints Major Breakout
Amid the recent market recovery, the Solana price witnessed a significant surge from $169 to $265, registering a growth of 50%. The upswing currently challenges the $265 neckline of a well-known reversal pattern called Cup-and-Handle. The chart pattern is characterized by a U-shaped recovery indicating market accumulation followed by a temporary pullback before the imminent breakout.
The long-wick rejection candles at the aforementioned resistance indicate overhead supply delaying the pattern breakout. A potential 4.6% surge will flip the neckline resistance into potential support, kicking the post-breakout rally. With sustained buying, the Solana price could rally 51% to reach the $375 mark, followed by the $500 level.

On the contrary note, the lower high formation in the daily RSI slope reflects the sellers aggressively defending the $265 resistance. If the coin price breaks below $217 support, the buyers will lose strength and risk a renewed correction trend.
Also Read: Bitcoin Price 60-day Pattern Nears End As Whale Activity Hits Record High


