

On February 13th, Thursday, the crypto market showed a surge in selling pressure ahead of President Donald Trump’s plans to announce a fresh round of reciprocal tariffs. As a result, the Bitcoin price prolongs its consolidation around the $95,000 level while limiting recovery attempts in most major altcoins. However, the social media sentiment surrounding the SUI price indicates the potential for renewed recovery.
Key Highlights:
- Santiment data reveals a 5:1 ratio of positive to negative sentiment, the highest in five months.
- The 20-day exponential moving average acts as dynamic resistance to the current correction trend.
- The $2.9 support coinciding with the 50% Fibonacci retracement level and 200-day EMA creates a high accumulation zone for buyers.
Santiment Data Shows Peak Bullish Sentiment for SUI in Five Months
Defying the broader market consolation, the SUI price showcased a quick rebound from $2.9 to $3.4 level — a 20% increase — in the last 4 days. Consecutively, the asset’s market cap surged to $10.79 Billion, while the 24-hour trading volume is at $1.52 Billion.
This uptick aligns with growing social media optimism, as data from Santiment reveals a 5:1 ratio of positive to negative sentiment—the highest bullish sentiment on Sui in five months. The project’s positioning as a Web3 enabler with Web2 ease, coupled with increasing traction in DeFi and gaming, continues to fuel its adoption.
While the market sentiment could drive a bullish trend till the weekend, traders must remain cautious against excessive retail-driven FOMO, as it could delay a more sustained rally.

SUI Price Faces Crucial Test at 20-Day EMA
The daily chart analysis of the SUI price shows a notable bounce from $2.9 support. This horizontal level coincides closely with two major pullback supports, i.e., 200-day EMA and 50% FIB.
The trending defining 200-day EMA indicates the long-term trend in SUI remains bullish, while the 50% FIB shows the current correction is healthy to replenish the exhausted bullish momentum.
Despite the 2.19% intraday loss, the coin price stands at the doorstep of 20-day EMA resistance at $3.57. A potential breakout will signal an early sign of trend reversal and bolster buyers to challenge the $4.2 and $5.36 resistance.
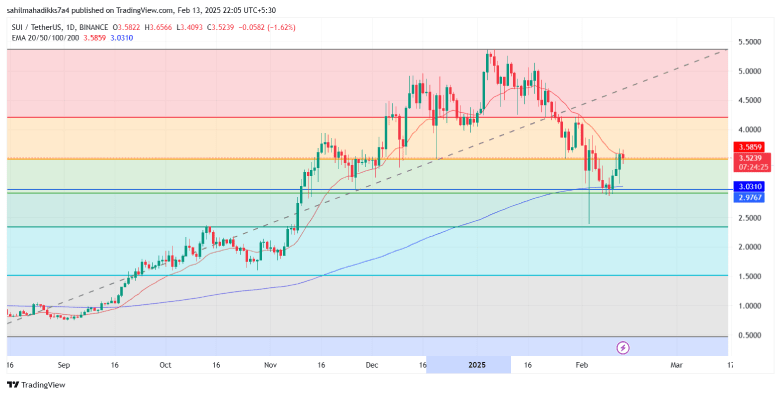
Conversely, if bulls failed the aforementioned breakdown, the bears could attempt a breakdown below $3 support, intensifying the market selling pressure.
Also Read: OpenSea to Launch $SEA Token for Loyal Platform Users


