

The first three weeks of February have reflected uncertain market sentiment, with Bitcoin consolidating below $100K and struggling to establish a clear trend. Amid this sideways movement, altcoins like SUI face the risk of an extended correction, as historical patterns indicate the possibility of another major breakdown.
According to CoinGecko, the SUI price is currently trading at $3.2, with an intraday loss of 1.35%. Meanwhile, the asset’s market capitalization is at $9.9 Billion, while the 24-hour trading volume wavers at $812.5 Million.
Key Highlights:
- Crypto analysts identified a concerning similarity between SUI’s current price action and its pattern from April 2024, a period that preceded a notable correction.
- The SUI price is forming a short consolidation between 100-and-200-day EMA.
- A V-top reversal in the daily chart highlights high momentum selling in the market,
SUI Price Action Mirrors April 2024 Pattern
In a recent tweet, crypto analyst Ali Martinez drew attention to an intriguing development in SUI’s price action, highlighting that the asset is exhibiting a pattern similar to what was observed in April 2024. The post features a side-by-side comparison of two charts, and how the current price movement could follow the past correction trend.
In the last six weeks, the SUI price showcased a V-top reversal from $5.3 to $3.2 level, losing 41.4% in value. The falling price is now seeking support around the 200-day EMA at $3, maintaining its broader market uptrend.
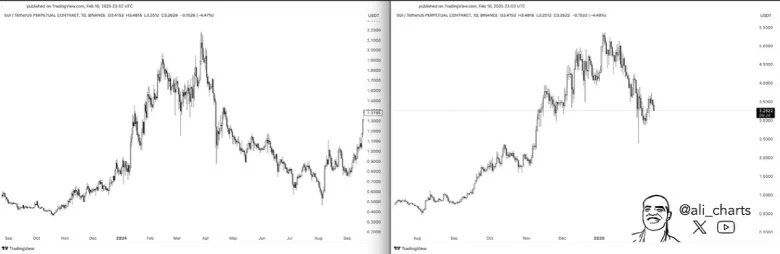
The daily chart currently shows a notable top formation and fresh lower high to indicate sell-the-bounce sentiment in the market. In 2024, the whole correction plunged the SUI price by 78.8% before bottoming at $0.46.
If history repeats itself, the coin price could plummet another 63% to hit a low of $1.16.
Technical Indicators:
Relative Strength Index: The daily RSI slope dropped to 40%, indicating bearish sentiment among market participants, which is suitable for extending price correction.
Exponential Moving Average: The SUI coin price potential consolidation trend forms between the 100-and-200-day EMA slopes. While the price sustaining above 200-day EMA signals buyers’ strength, a possible breakout from 100 EMA could invalidate the bearish thesis.

Also Read: Ethereum ETFs See 7x More Inflows in February; Is $4k Rebound Next?


